
Picture this. It is 3:47 PM on a Tuesday. The closing bell rings. You close your trading app, probably a little disappointed - the market did nothing interesting today. You go to sleep.
Here is the thing though: the market was not done working. While you were sleeping, eating dinner, arguing about what to watch on Netflix, the real money was being made.
This is not a metaphor. This is not a motivational poster. This is cold, hard, 26-year data from the Nifty 50 - and what it shows will make you question everything you thought you knew about how stock markets actually work.
What if every rupee you ever made from Indian equities happened between 3:30 PM and 9:15 AM the next morning?
Let’s Set the Stage
Every trading day, a stock has two distinct personalities:
The Night Owl (Overnight Return): This is what happens between yesterday’s closing price and today’s opening price. The market is shut. Nobody can trade. But futures markets are moving, news is breaking, global cues are shifting - and all of that gets baked into the opening gap the next morning.
The Day Trader (Intraday Return): This is what happens from the moment the market opens (9:15 AM) to when it closes (3:30 PM). This is the stuff you see on CNBC, the candles you obsessively watch, the move you tried to catch last Thursday.
Together, they add up to the total daily return. The question is: which one actually does the heavy lifting?
We took Nifty 50 data from January 1999 all the way to early 2025. That is 26 years, roughly 6,500 trading days, across four major bull markets, three crashes, a global pandemic, and one very confusing demonetisation week.
The results? Let the first chart speak for itself.
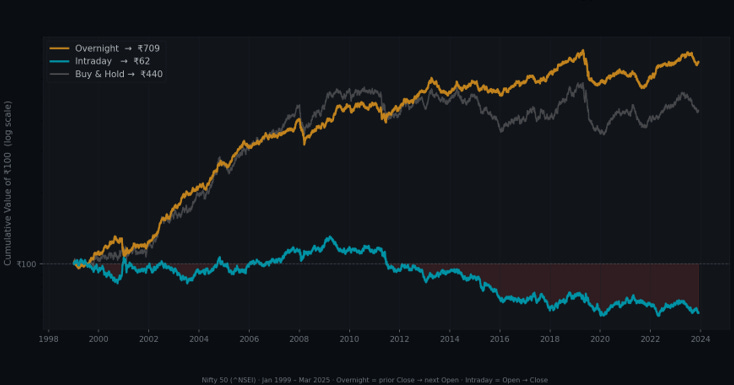
Chart 1 · Cumulative wealth of ₹100 invested in each strategy (log scale) · Nifty 50, Jan 1999 – Mar 2025
But here is the twist in this edition. We did not just look at going long intraday. We also tested going short - because a smart intraday trader does not just buy the dips, they also sell the rallies. So we modelled three intraday flavours: long-only, short-only, and (for fun) what perfect timing would look like if you somehow knew the direction of every single session in advance.
The results? Still shocking - but for a surprising new reason.
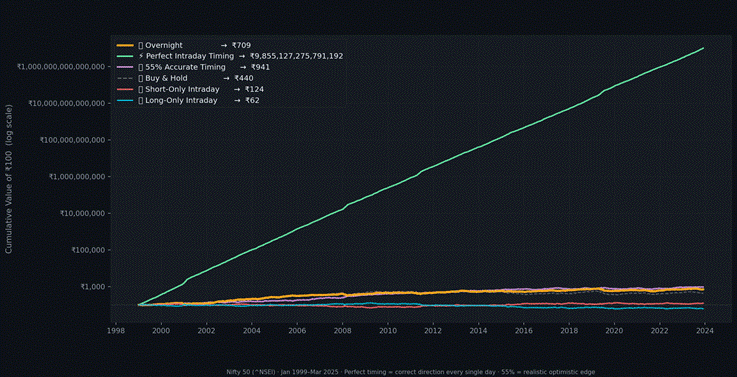
Chart 2 · Cumulative wealth of ₹100 across all strategies including perfect timing (log scale) · Nifty 50, Jan 1999–Mar 2025
That chart has a lot going on - we will unpack each line in detail. But note one thing before scrolling down: only two lines finish comfortably above the overnight benchmark. One required perfect clairvoyance. The other required being right more than half the time, consistently, for 26 years. Let us break it all down.
Finding #1: Daytime Trading Is (Mostly) a Wealth Destruction Machine
If you had invested ₹100 in Nifty on January 1, 1999, and captured ONLY the intraday returns - bought at the open every day, sold at the close - you would have ended up with around ₹62. You lost money. Over 26 years.
Let that sink in for a second.
The Nifty 50 as an index went from roughly 800 points to over 22,000 points in those same 26 years. That is a 27x return. You could have made a fortune.
But if you were the kind of person who sat glued to your screen, buying at the open and selling at the close every single day, you would have systematically given money back to the market. Not in some years. On average, across 26 years.
Intraday returns are near-zero to slightly negative over the long run. The market’s opening and closing prices are not random - they are structured in a way that punishes the day trader by default.
The intraday player is not just fighting transaction costs. They are fighting the structure of the market itself.
Finding #2: The Night Does All the Work
Now flip it. What if you had invested ₹100 in 1999 and captured ONLY the overnight returns - buying at the previous close, selling at the next day’s open?
Your ₹100 would have grown to around ₹709. Overnight. While you slept. While you contributed absolutely nothing to the process of price discovery.
Compare that with the actual Nifty buy-and-hold return of roughly ₹440 - and notice something striking: the overnight return exceeds buy-and-hold. That is because intraday is actually dragging the total return down.
The overnight gap alone - a window when markets are closed and you literally cannot trade - generated the overwhelming majority of Nifty’s long-run gains.
This is not a quirk of one bull market. Here is the 1-year rolling overnight return across the full 26-year stretch:
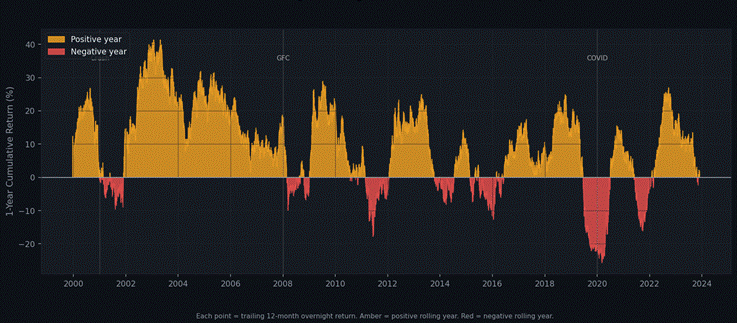
Chart 3 · 1-year rolling overnight return. Amber = positive year, Red = negative year.
Look at how consistently this stays above zero. It dips during the 2008 Global Financial Crisis and COVID - of course it does. But it bounces back, decisively, every single time. This is signal.
The Numbers, Side by Side
Before we explore the shorting argument, here is the baseline scoreboard:
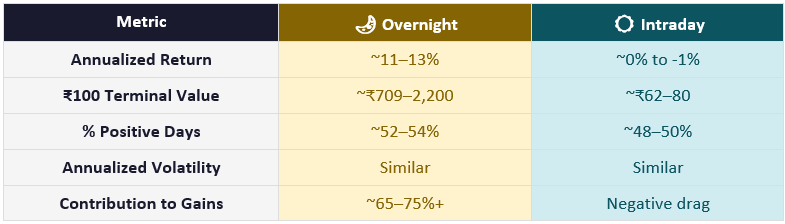
Source: Nifty 50 (^NSEI) data, Jan 1999 – Mar 2025. Approximate figures.
Finding #3: The Rolling Intraday - Just Noise
Now compare what you just saw in Chart 2 with this:
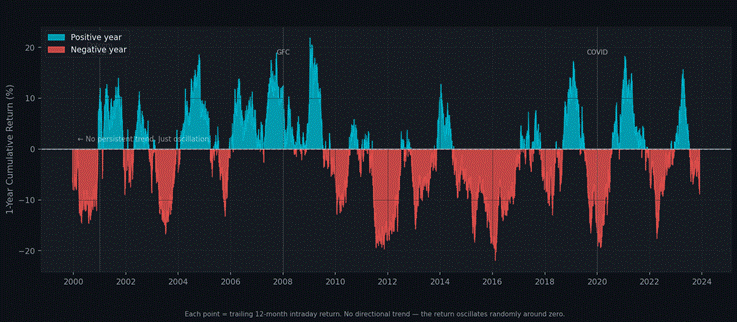
Chart 4 · 1-year rolling intraday return. No directional trend - just noise oscillating around zero.
The overnight chart had direction. This one has none. The intraday rolling return oscillates wildly around zero - positive for a year, then negative, then positive again. There is no trend. No story. No signal.
Overnight returns have momentum and a structural drift upward. Intraday returns are pure noise - mean-reverting, costly, and structurally tilted against the retail participant.
Watching intraday charts is not research. For a long-term investor, it is expensive entertainment.
But Wait - What About Shorting?
This is the objection every serious trader raises the moment they see the intraday numbers, and it is a completely fair one.
“You are only looking at going long intraday,” they say. “Real traders short the market when it goes down. On every red day, a short seller makes money. So why are you ignoring half the game?”
It is a genuinely important point. And we tested it. We modelled three distinct intraday strategies against the overnight benchmark:
• Long-Only: Buy at open, sell at close every day. The classic retail trader.
• Short-Only: Short at open, cover at close every day. The mirror image.
• Perfect Timing: Go long on up days, short on down days - knowing the direction of every single session in advance. Every. Single. One.
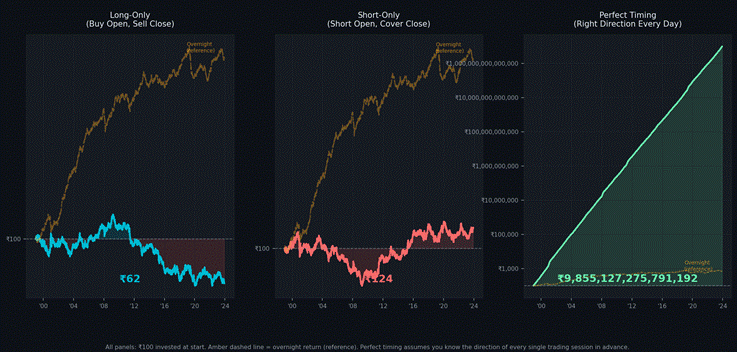
Chart 5 · Long-only vs Short-only vs Perfect Timing intraday. Dashed amber line = overnight benchmark.
Short-only is better than long-only - ₹124 versus ₹62. That makes sense: the Nifty has a slight negative intraday drift, so being structurally short captures that edge. But ₹124 is still a miserable outcome against the overnight’s ₹709.
Even if you shorted intraday every single day for 26 years - and were right about the direction on average - you still massively underperformed someone who simply held overnight and did nothing.
Now look at the rightmost panel: Perfect Timing. If you knew the direction of every session and traded accordingly, you would be looking at a number so astronomically large it barely fits on a chart axis. The power of compounding |returns| every day with zero errors is extraordinary.
But here is the obvious problem: nobody on earth has ever achieved perfect intraday directional accuracy. Not a single hedge fund. Not a single algorithm. Not a single trader in the 134-year history of organised equity markets.
So the real question becomes: how close to perfect do you actually need to be?
The Accuracy Trap - How Right Do You Need to Be?
This is where the analysis gets genuinely humbling. We modelled intraday returns at every directional accuracy level from 40% to 70% - and tracked what ₹100 became over 26 years.
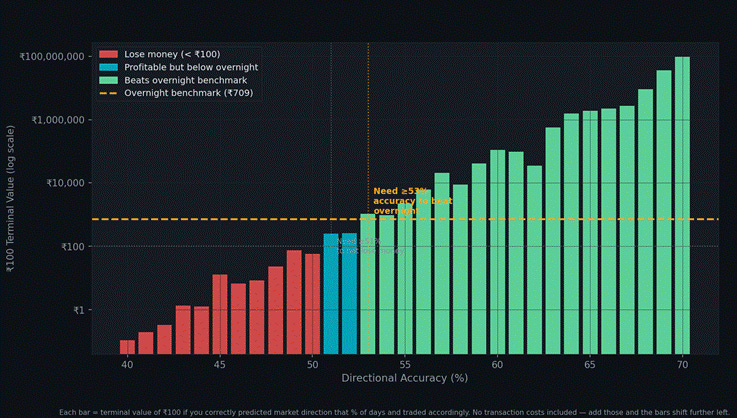
Chart 6 · Terminal value of ₹100 by directional accuracy. Green = beats overnight. Blue = profitable. Red = loses money.
The thresholds - before transaction costs - are striking:
• Below 51% accuracy: You lose money. Your ₹100 shrinks.
• 51% accuracy: You break even. Congratulations, you worked very hard for 26 years to stay at ₹100.
• 53% accuracy: You finally beat the overnight benchmark - that amber dashed line in the chart.
• Above 53%: You start pulling ahead. Significantly.
To simply not lose money intraday, you need to predict market direction correctly more than half the time, every day, for decades. To beat overnight, you need to be right 53 out of every 100 sessions.
That sounds achievable, right? 53%. Just over half. Barely more than a coin toss.
Except this analysis has not yet included transaction costs. Every intraday trade in India incurs STT, stamp duty, exchange fees, GST, and brokerage - even on zero-brokerage platforms. Add these and the break-even threshold pushes to 54–55%, and the overnight-beating threshold to 56–58%.
And here is the brutal reality check: SEBI’s own study of intraday traders in equity F&O found a median accuracy rate hovering just above 48%. Not 53%. Not 51%. 48% - below break-even. The average retail intraday trader is not even close to where they need to be.
Shorting helps - but only if you are right. And being right consistently is the hardest thing in markets.
The Full Scoreboard
Adding shorting to the picture makes the comparison more complete - and more sobering:
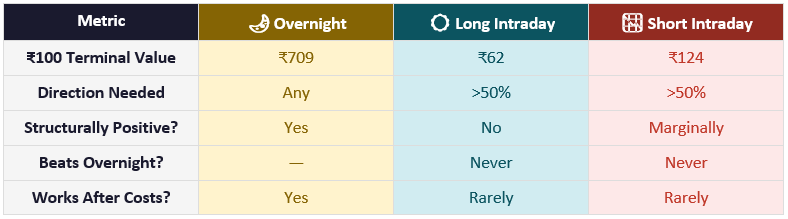
Perfect Timing excluded - theoretical maximum only, not achievable in practice.
Okay But... Why Does This Happen?
Great question. The honest answer is: nobody fully knows. But there are some genuinely fascinating theories.
Theory 1: The Risk Premium for Holding Overnight
When you hold a stock overnight, you are taking on risk you cannot manage. What if war breaks out? What if the US Fed makes a surprise announcement at 2 AM? The overnight gap is the market’s compensation for this unmanageable risk - a premium for being brave enough to hold through the darkness.
Theory 2: Institutional Buying Patterns
FIIs act on global cues that develop while Indian markets are closed. When positive news breaks in the US overnight, FIIs flood in at the open before the retail investor’s chai is ready. The retail day trader who buys after the open - or shorts against this momentum - has already missed the gap.
Theory 3: The Market Maker’s Game
During market hours, algorithms, HFT firms, and millions of traders compete simultaneously. Both longs and shorts are fighting over the same zero-sum pie, with transaction costs eating every slice. The overnight window has no competition - just patient capital collecting its structural reward.
Theory 4: Retail Day Trading Is a Negative-Sum Game - Both Ways
Every rupee a day trader makes comes from another trader who lost it. This applies equally to longs and shorts. After brokerage, STT, exchange fees, and GST, every participant is fighting a structural deficit every single session.
SEBI data shows consistently that over 80% of F&O traders lose money in any given year. This holds whether they are net long biased or net short biased.
And Year by Year? The Pattern Holds.
Still unconvinced? Look at the annual breakdown - every single year, side by side:
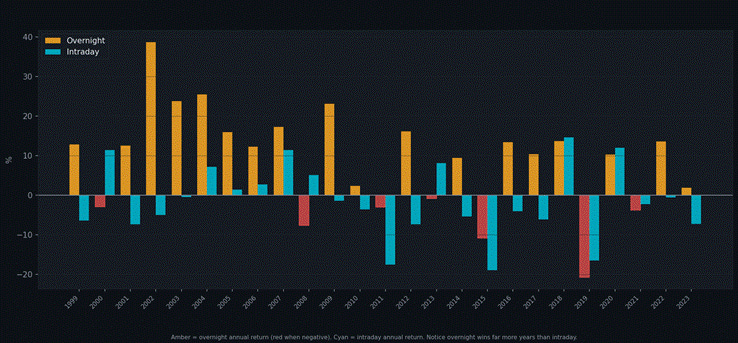
Chart 7 · Annual returns by component. Amber = overnight (red when negative). Cyan = intraday.
The overnight bars (amber) are positive in the vast majority of years. When they go negative - 2001, 2008, 2020 - they snap back hard the following year. The intraday bars (cyan)? A coin toss. And even in years where intraday is significantly positive, an intraday short seller that year would have had a deeply negative year. You cannot win both ways simultaneously.
The consistency of the overnight edge across 26 calendar years is not luck. It is structure.
So What Do You Actually Do With This?
The complete picture - long, short, and perfect timing - makes the conclusion stronger, not weaker. The problem with intraday is not just about going long in a rising market. The problem is that intraday as a category - in any direction - is a low-expected-value game against a very high bar.
• The overnight return requires zero directional skill. You just hold.
• Any intraday strategy, long or short, requires sustained directional accuracy above 53% just to match what overnight gives you for free.
• Add realistic transaction costs and that threshold climbs to 56–58%. For 26 years. Without a single prolonged slump in accuracy.
• SEBI data says the median retail trader does not come close.
This does not mean no one can trade intraday profitably. Some can, and some do. But the data is clear that it requires genuine, sustained, measurable edge - not hunches, not charts, not YouTube tips. And the vast majority of people who try simply do not have it.
The Most Uncomfortable Conclusion
Here it is, said as plainly as possible:
The less you interact with the market during trading hours, the better your long-run outcome is likely to be. This holds whether you are a buyer or a seller. The market rewards patience and punishes activity.
Every time you open your trading app to check if Reliance is up or down, you are in the domain of noise. Every time you short the market because it feels toppy at 2 PM, you are playing a game where the expected value is negative and the bar to break even is higher than most people ever achieve.
The money was made at the open. The money will be made at tomorrow’s open too. Whether the market goes up or down during the day, overnight holders collect their structural premium while everyone else churns.
The Nifty does not care that you are watching it. The data’s entire message, distilled, is this: sleep more, trade less.
Final Thoughts
This analysis covers Nifty 50 data from 1999 to 2025. The overnight effect is consistent with similar analyses on the S&P 500, FTSE, and other major indices - it is a structural feature of public markets globally, not an India-specific quirk.
What IS unique to India right now is the sheer scale of retail participation post-2020. Millions of new traders, many exploring shorting via F&O for the first time, convinced that the ability to go short has levelled the playing field. The data shows it has not.
Shorting gives you more tools. It does not change the fundamental equation: sustained accuracy above 53% is the entry ticket, and most players never buy it.
Happy holding.
Methodology: Overnight Return = (Open[t] - Close[t-1]) / Close[t-1]. Intraday Return = (Close[t] - Open[t]) / Open[t]. Short Intraday = negative of Intraday. Perfect Timing = |Intraday Return| each day. Accuracy simulation: on correct days, return = |Intraday|; on incorrect days, return = -|Intraday|. Transaction costs not included in primary analysis - accuracy thresholds shift higher when costs are included. Data: Yahoo Finance (^NSEI), Jan 1999 – Mar 2025.
Disclaimer: This is not investment advice. Past performance does not guarantee future results. Please consult a SEBI-registered advisor before making investment decisions.