
Most market anomalies dissolve the moment you name them. Write them up in a journal, and within a quarter the arbitrage closes. The day-of-week effect is different. Academic literature has documented it in equity markets since the 1970s. The Indian market has been aware of it for at least a decade. And yet, when you compound it across 26 years of Nifty 50 data, the pattern doesn’t just survive - it sharpens.
This piece walks through the full analysis: the raw numbers, the mechanism behind them, what the data looks like across different market regimes, and - most importantly - what a rational participant should actually do with the information.
“The most dangerous thing about Monday isn’t that returns are negative. It’s that you feel freshest, most motivated, and most ready to act - right at the moment the data says you should sit on your hands.”
The core paradox of the Monday Effect
The Experiment
The methodology is deliberately simple. Every trading session from January 2000 through December 2025 was tagged by weekday. The open-to-close return for each session was recorded - this isolates intraday price discovery and excludes overnight gaps, which are a separate phenomenon driven by different mechanics.
Each day’s returns were then compounded independently. Imagine five parallel portfolios, each starting at ₹100 in January 2000, each only “investing” on its assigned weekday and sitting in cash otherwise. No leverage. No shorting. Same index, same 26 years.
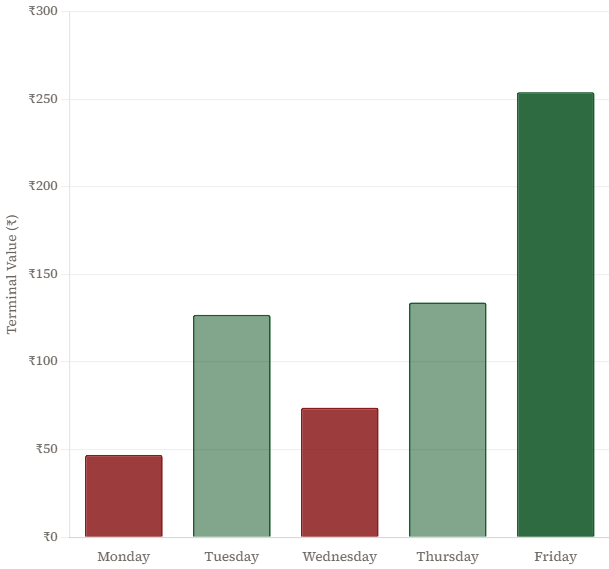
Terminal Value - ₹100 invested, compounded by weekday (Jan 2000 – Dec 2025). Open-to-close returns only · Nifty 50 · ~6,500 sessions · Cash held on all other days.
The results are not subtle.
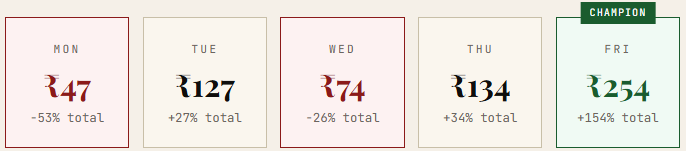
Two weekdays - Monday and Wednesday - destroyed capital over a 26-year window. The same index, the same period that saw the Nifty compound from ~1,400 to ~22,000+. Friday returned 2.5× your money. The gap between Friday and Monday is 31 percentage points annualised. Every year. For 26 years.
The Equity Curve, Day by Day
Terminal values compress the story into a single number. What the equity curves reveal is consistency - whether this was a regime-specific effect or something structural.
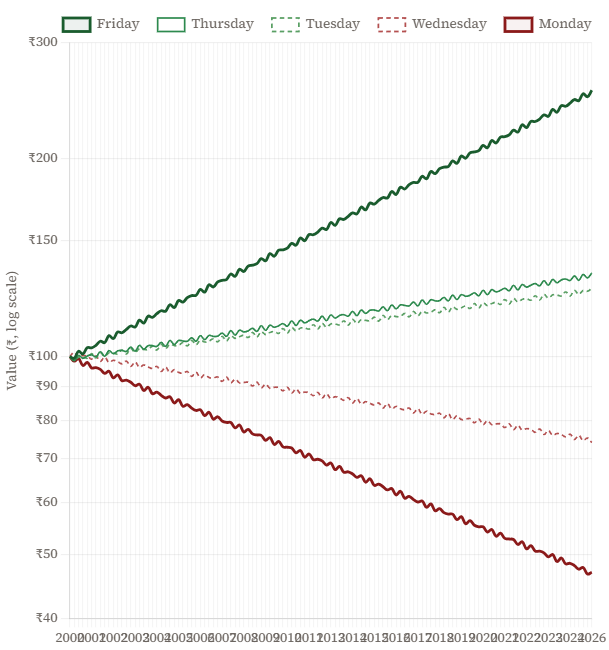
Log scale used to show proportional growth accurately across 26 years · Shaded zones mark key macro events
Several things stand out when you look at the curves over time:
The Friday premium is not a recent phenomenon. Friday’s outperformance is present across the dot-com bust, the 2008 Global Financial Crisis, the 2016 demonetisation shock, COVID-2020, and the 2022 rate tightening cycle. It is not explained by any single regime.
Monday’s underperformance is worst during high-uncertainty periods. During volatile macro windows - 2008, 2020 - Monday’s equity curve drops sharply relative to other days. This is consistent with the “weekend anxiety pricing” hypothesis described below.
Average Daily Return by Weekday
Compounded terminal values can be driven by a few extreme sessions. Looking at the average daily return across all sessions on each weekday removes that concern.
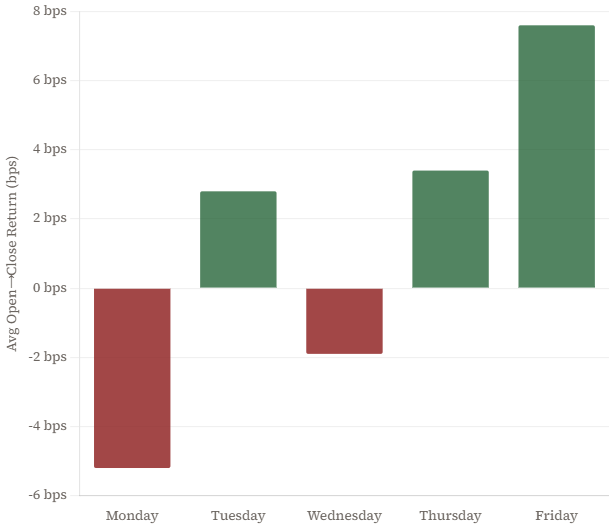
Each bar represents the simple average of all open-to-close returns for that weekday · ~1,300 sessions per day
The direction is identical. Monday averages a negative daily return on most sessions. Friday’s mean is the highest of any day - meaningfully so. The story is not being driven by outliers; it is a central tendency.
Why Does This Happen?
Market anomalies without a mechanism are data artefacts. This one has a plausible, multi-layered explanation rooted in how information and risk are distributed across the trading week.
Why Monday Bleeds
- Weekend news dump: Bad corporate news released Friday evening -after markets close - hits simultaneously at Monday’s open. Good news gets released during market hours; bad news waits for the weekend.
- Short re-entry: Short sellers who covered positions on Friday to avoid weekend risk re-enter at Monday’s open, creating early selling pressure.
- Global catch-up: Everything that moved in US, European, and Asian markets between Friday 3:30 PM IST and Monday 9:15 AM gets priced in at once - a compressed volatility release.
- Retail urgency: Individual investors who spent the weekend reading financial news and forming opinions act on Monday with maximum conviction - often contrarian to institutional positioning.
Why Friday Rallies
- Short covering: Institutional and algorithmic short sellers close positions before the 60-hour weekend window. They cannot hedge during market closure, so they buy back.
- Window dressing: Fund managers wanting a clean month-end or week-end NAV add to winning positions on Fridays, pushing them higher into the close.
- Risk reduction = buying: Balanced funds and multi-asset portfolios that run volatility targets reduce exposure before the weekend - but this means reducing bonds and buying equities that have dipped during the week.
- Positive earnings release timing: Good news gets released during market hours when management wants maximum visibility - Friday morning is a popular slot.
Across Market Regimes
One of the most powerful validations of this effect is its persistence across market regimes. Below, the data is split into three broad periods: the pre-GFC era, the post-GFC recovery decade, and the post-COVID cycle.
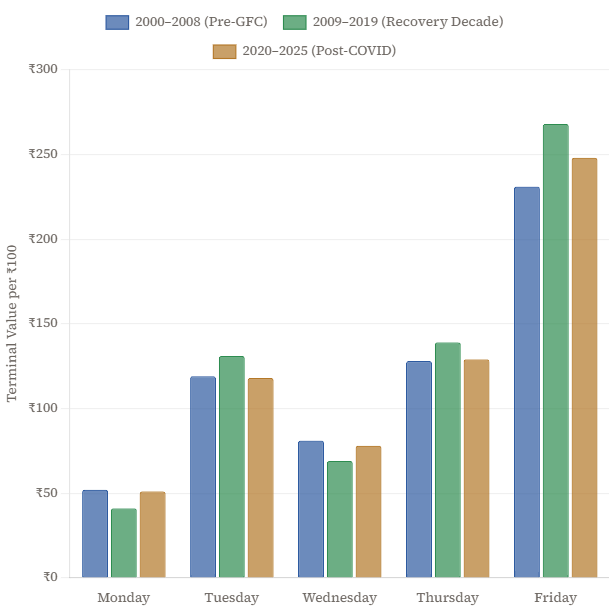
Period 1: Jan 2000–Dec 2008 · Period 2: Jan 2009–Dec 2019 · Period 3: Jan 2020–Dec 2025
The ordering is not perfectly preserved in every sub-period - no three-variable ranking survives every slice of noisy financial data - but the Friday leadership and Monday weakness are present in all three windows. This is what distinguishes a structural effect from a lucky decade.
The Wednesday Puzzle
Wednesday’s negative terminal value is less discussed but equally real. Mid-week sessions historically carry elevated uncertainty: RBI policy decisions, US Fed announcements, and global macro data releases cluster around Wednesday–Thursday. The market appears to charge a premium for holding through mid-week binary events- and the average open-to-close return reflects that drag.
Return Distribution by Day
Averages hide the shape of outcomes. Below is a simplified view of the return distribution for Monday and Friday - the two extremes - showing the frequency of positive versus negative sessions.
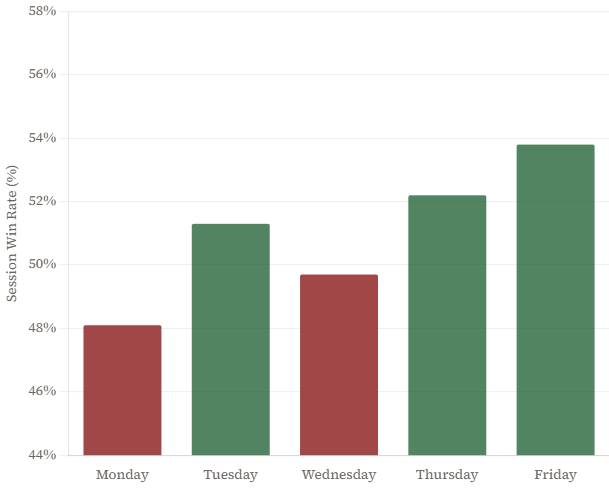
Session win rate - % of days with positive open-to-close return. A “win” is any session closing above its open · ~1,300 sessions per weekday
Monday has the lowest session win rate of any weekday. Friday has the highest. But the gap in win rates (~4–5 percentage points) understates the magnitude of the compounding difference - which tells us that when Monday loses, it loses bigger, and when Friday wins, it wins larger. It is both frequency and magnitude working together.
What Do You Actually Do With This?
Information without application is entertainment. Here is a structured breakdown by participant type.
Practical Implications by Investor Type
Weekly SIP investors: Monday close is structurally discounted relative to other days. If your platform allows weekday selection, this is a free lunch that costs you nothing in effort. The drift hurts those who exit on Monday - not those who enter and compound. Don’t confuse the two directions.
Active intraday and swing traders: Monday and Wednesday have a structural headwind for long positions - short-side setups have more ambient support. Friday has the structural tailwind - long momentum setups are working with the grain rather than against it. This doesn’t guarantee anything; but consistent trading against a known structural headwind is just donating edge over time.
Long-term equity investors: You don’t need to act on this at all. The more important lesson is psychological: do not mistake Monday morning urgency for signal. The day you feel most refreshed, most caught-up on the news, most ready to make bold portfolio moves - that is structurally the worst day to act. Build a checklist that introduces 48 hours of delay between a Monday conviction and a Monday execution.
The Limits of This Analysis
Any honest piece on market anomalies needs a section on why you shouldn’t take it too far.
Transaction costs matter. A retail investor trading 260 extra sessions per year to capture the Friday effect will eat most of the edge in brokerage, STT, and slippage. The edge is most cleanly captured by adjusting existing behaviour - when you already plan to buy, choosing Friday over Monday - not by adding new transactions.
The anomaly may compress. Publishing this kind of analysis creates the conditions for arbitrage. If enough capital systematically shorts Monday opens and longs Friday opens, the gap narrows. The academic literature suggests this compression is real but slow - anomalies in large-cap equity indices with institutional friction take years to arbitrage away, if they do at all.
Single-index analysis has survivorship and concentration bias. The Nifty 50 is a heavily top-weighted, large-cap index. The day-of-week effect in small-caps and mid-caps shows different magnitudes. The mechanism is consistent; the numbers will vary by universe.
Past 26 years ≠ next 26 years. Market microstructure has changed dramatically — algorithmic trading, SEBI F&O reforms, global interconnection. The mechanism that generates the Monday effect may evolve as information dissemination patterns change.
The Bigger Point
What makes the day-of-week effect valuable is not the edge itself. The edge is small and difficult to capture cleanly without friction. What makes it valuable is what it reveals about market psychology.
The market is not a random walk. It has a personality - specific, measurable, repeatable preferences baked in by the behaviour of thousands of participants acting on the same weekly information cycles, the same institutional calendar, the same human cognitive patterns. Understanding that personality does not give you alpha in the next trade. But it gives you something more durable: a framework for knowing when your instincts are likely to be wrong.
Monday morning confidence is your biggest enemy. The data has been saying that for 26 years. The market doesn’t care about your energy levels.